[NGW Magazine] Global Emissions are Up, in BP's Analysis
BP’s Statistical Review of World Energy 2018 shows some backsliding in terms of emissions compared with previous years and generally the longer-term picture is not great for Paris, even if gas has made gains.
Presenting the UK major's Statistical Review of World Energy 2018 in London June 13, CEO Bob Dudley said that the rebalancing of oil production and demand had led to a strong recovery of oil prices in 2017. But he warned that this is a short-term effect that is unlikely to persist.
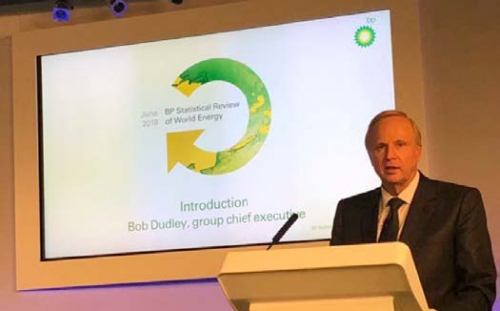
Bob Dudley, BP CEO, opens the meeting (Credit: Charles Ellinas)
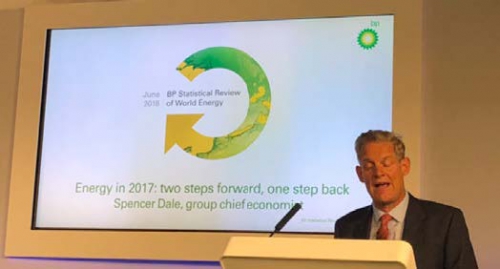
Spencer Dale, BP’s chief economist, addresses the meeting (Credit: Charles Ellinas)
On the other hand, natural gas demand rose sharply, driven by China and improving accessibility to gas should help it grow further. In addition, renewables exhibited strong growth and have a great future. The setback was that carbon emissions, after flat-lining during the past three years, rose by 1.6% in 2017.
Dudley stressed that BP is a strong advocate of carbon pricing as a means of driving emissions down.
Chief economist Spencer Dale summed 2017 as a year of two steps forward, one step back in terms of world energy.
He started his presentation with the bold statement that “Our aim when producing the Statistical Review is that it should be the one-stop shop of choice for all your statistical needs.” This, though, may not be an exaggeration. BP produces a most comprehensive set of energy statistical data, which, as Dale says, is annually “updated and impeccably sourced.”
The key findings of this review were that in 2017:
- With global GDP picking up, global primary energy demand rose by 2.2%, the fastest since 2013.
- This growth was led by natural gas and renewables. Coal demand also rose by 1%. Two steps forward, one step back.
- A consequence of these was that energy related carbon emissions grew by 1.6%, after three years’ stability.
- In addition, the rate of growth in energy productivity – the amount of GDP the economy extracts from a unit of energy – slowed all over the world.
- Global oil demand growth continued to be high, at 1.8% or 1.7mn b/d, as a result of low prices.
- Natural gas demand growth of 3% was the fastest since 2010. This was led by China.
- Natural gas production grew by 4%, double the last 10-yr average, led by Russia.
- Growth in LNG trading outpaced growth in pipeline gas.
- Coal demand growth was led by India and China, with OECD demand falling for the fourth year.
- Renewables grew by 17%, the largest increment on record, led by wind.
- Power generation grew by 2.8%, with almost all growth coming from emerging economies.
- Renewables accounted for 49% of this growth in power, but coal was close behind with 44%.
- Renewables now account for 8.4% of global power generation, up from 7.4% in 2016.
These results may be seen as alarming in terms of energy transition, with both coal demand and carbon emissions going up. BP, though, considers these to be short-term adjustments and unlikely to persist, rather than long-term trends. As Dale said, these “should be seen in the context of the exceptional outcomes recorded in the previous three years. Some backsliding was almost inevitable.”
However, perhaps the most startling and striking graph BP presented is one that shows the share of coal, oil and gas and non-fossil fuels in global power generation over the last 20 years (Figure 1).
Figure 1: Fuel shares in power generation
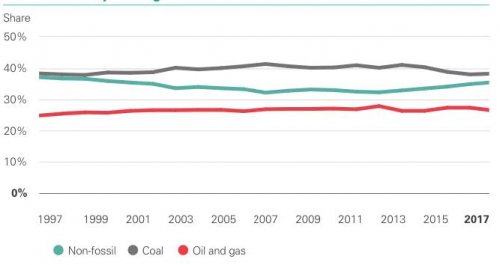
Despite the exponential growth in renewables over this period, and huge policy effort to encourage this, the global power generation mix does not appear to have changed significantly during the past 20 years.
Coal provided 38% of this mix in 1998 and 20 years later it is still providing 38%. Over the same period fossil fuels actually increased their share from 63% to 65%.
However, the shares of global primary energy demand by fuel demonstrate the continued ascendancy of gas and renewables, wind and solar (Figure 2). This is a good sign for the future.
Figure 2: Shares of global primary energy demand by fuel
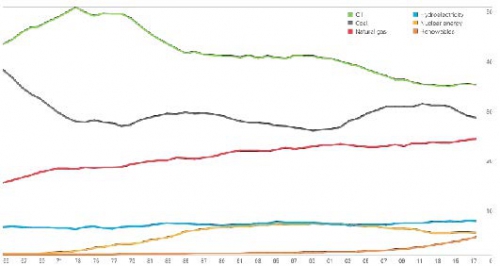
Nevertheless, the share of fossil fuels declined only slightly, to 85%, in comparison to 85.3% in 2016.
Oil demand and supply
Oil remains the world’s dominant fuel, making up just over a third of all energy consumed. Even though its share of global primary energy demand has been declining, it has remained more or less steady over the past five years, at just over 34%.
As a result of the action taken by producers in 2016, oil demand and supply are back in balance and inventories are getting close to normal levels (Figure 3). As a result, the oil price (Dated Brent) averaged $54.2/barrel in 2017, up from $43.7/barrel in 2016. During the first half of 2018 it rose to around $75/barrel, but this is unlikely to persist.
Figure 3: Oil demand and supply growth
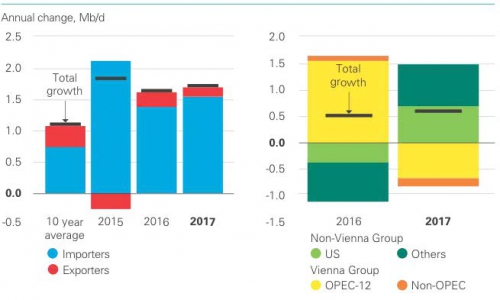
Oil demand grew by 1.7mn b/d in 2017, much higher than the 10-year average of 1.1mn b/d, benefiting from low prices, and despite increasing car efficiency and EV uptake. Peak oil demand appears to be still some time away.
Surprisingly, this growth was led by a strong increase in diesel demand, as a result of an acceleration in global industrial activity.
In terms of supply, output by Opec and others included in the production agreement fell 0.9mn b/d, while oil production by other countries grew by 1.5mn b/d, led by US tight oil production responding to higher oil prices.
A central part of the success of US tight oil has been the strong and continuous gains in productivity, as technology and know-how have improved over the past few years.
Opec still has the ability to smooth temporary disturbances in the oil market. But as BP says, if ‘Opec tries to resist more permanent or structural changes in the market, there is an increasing risk that these actions will quickly be cancelled out by the responsiveness of US tight oil.’
Natural gas and LNG
For natural gas 2017 was a year of strong growth, with both demand and production growing by 96bn m³, or 3%; and by 131bn m³, or 4%, respectively (Figure 4). This was the biggest year on year growth since 2008, the year demand fell. Gas now accounts for a record 23.4% of global primary energy.
Figure 4: Global natural gas production and demand growth
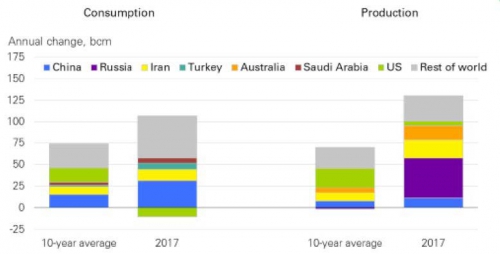
The growth in demand was led by China, followed by the Middle East and the rest of Asia. Growth in production was led by Russia, followed by Iran, Australia and China.
The single biggest factor driving global gas demand last year was the surge in China, where demand rose by over 15%, accounting for around a third of the global rise. This was driven by new measures to improve air quality in cities.
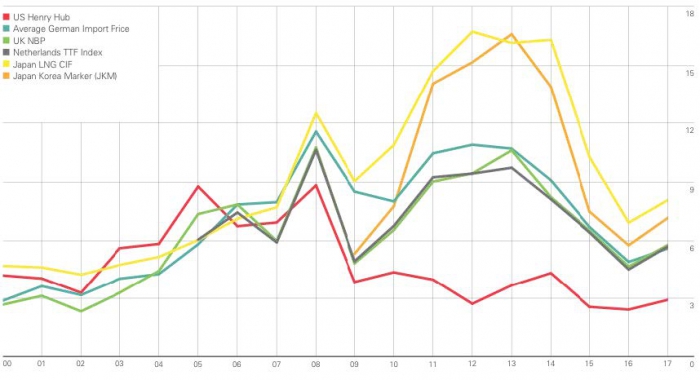
These measures encouraged Chinese industrial and residential users to switch away from coal, favouring gas. BP says that this higher demand looks set to continue this year, but it seems unlikely that it will be repeated in 2019 and beyond. This is bound to have a knock-on impact on prices. The high prices seen today might not persist (Figure 5).
Figure 5: Global gas prices
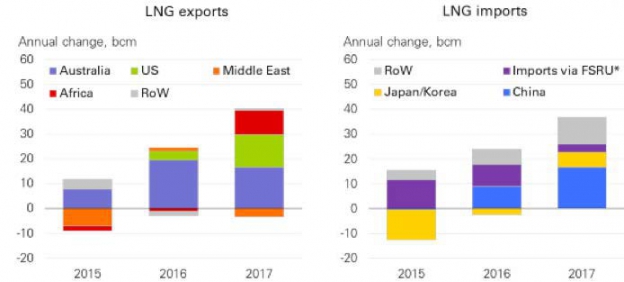
A key factor in the resurgence of gas was the rapid growth in LNG trade, which rose by 10% in 2017, led by the start-up of new trains in Australia and the US (Figure 6).
Figure 6: Increases in LNG
This rapid increase in global LNG trading is also leading to an increasing correlation between global markets and US gas prices. BP concluded that this correlation is likely to increase further as Henry Hub plays the role of the anchor price.
The much talked-about LNG glut did not materialise. This is partly due to technical reasons, with actual LNG supplies coming on stream less quickly than originally planned. But as BP says, it is also due to the fact that the surplus LNG supplies which did emerge resulted in bouts of unsustainably low prices rather than a build-up of idle capacity. Exporters were ignoring the full-cycle costs in favour of operating costs. Provided gas prices remain competitive, it has further to run.
Coal
Even though coal’s market share fell to 27.6% – the lowest level since 2004 – it is still demonstrating strong resilience. Its share of global primary energy has remained reasonably steady, fluctuating within a narrow band, over the past 40 years. Clearly coal is not going away.
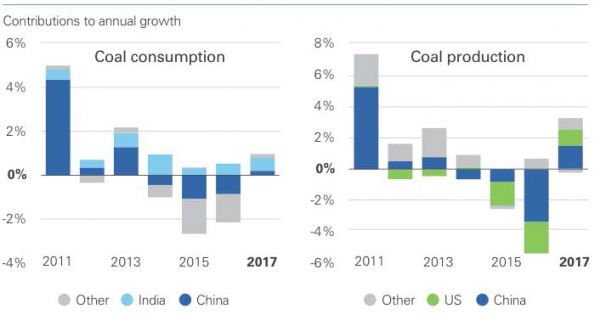
Both global coal production and demand actually rose in 2017, led by demand increases in India and China (Figure 7). This also meant that even though domestic demand fell in the US, production rose to feed exports to Asia.
Figure 7: Global coal production and demand
Power sector and renewables
Renewables continued to exhibit rapid and strong growth, increasing by 17%, higher than the 10-year average and the largest increment on record, at 69mn metric tons of oil equivalent (toe). But despite this, they accounted for only 3.6% of global primary energy in 2017.
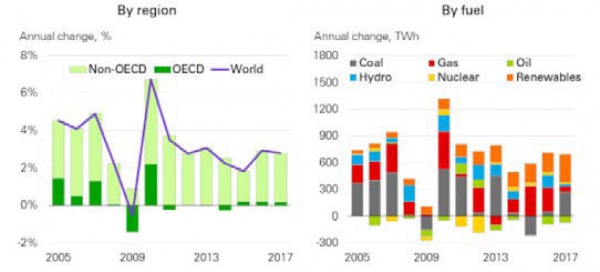
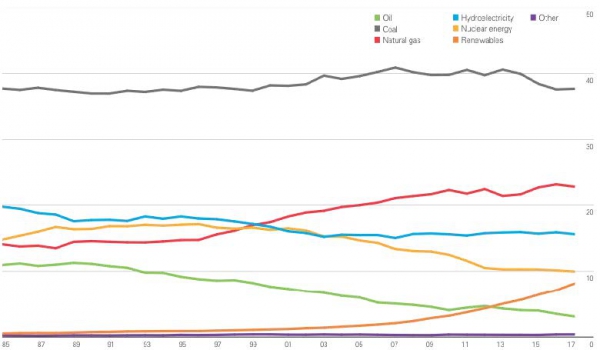
The power sector grew by 2.8% and absorbed more than 40% of global primary energy in 2017. It is the single biggest market for energy. Almost all growth came from the developing world (Figure 8). Renewables accounted for 49% of the growth in global power generation, with their share rising to 8.4% from 7.4% in 2016 (Figure 9). This was led by growth in wind at 17%, or 163 TWh, and a stunning 35% growth in solar, or 114 TWh. This was underpinned by policy support, but also by continuing falls in costs.
Figure 8: Growth in global power generation
Importantly, though, coal provided 44% of the growth in power generation in 2017, with natural gas limited to 10%, compensating for the decline in the use of oil.
However, Figure 8 also shows a gradual, but definite, shift to cleaner fuels over time. This may accelerate as the cost of wind and solar comes down. But intermittency is still a serious issue in need of an effective solution.
The power sector matters more than any other energy sector. It accounts for over a third of carbon emissions from energy demand. In order to have any chance of getting on a path consistent with meeting the Paris climate goals there is need for significant improvements in the power sector, which is still heavily reliant on coal with 38.1% in 2017.
However, despite the huge policy push encouraging a switch away from coal and the rapid expansion of renewable energy in recent years, there has been no discernible improvement in the mix of fuels feeding the global power sector over the past 20 years.
As BP says, this failure to make any inroads into the power sector for the past 20 years should be ‘both a cause for concern and a focus for future action.’ Growth in renewables is strong but it has failed to compensate for the decline in nuclear energy, coal and oil.
Dale summed this up in his presentation: “Personally, I am more worried by the lack of progress in the power sector over the past 20 years, than by the pick-up in carbon emissions last year.”
Figure 9: Share of global power generation by fuel
Carbon emissions
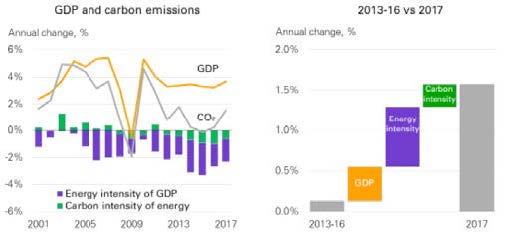
The growth in carbon emissions in 2017 by 1.6% (Figure 10), can only be seen as a backward step. This was driven by the above-average increase in global GDP, and the resulting increases in industrial activity and in coal demand.
Figure 10: Growth in carbon emissions
Even though these may be short-term factors, to some extent they may persist for longer. As a result, this increase in carbon emissions, combined with the lack of progress in the power sector over the past 20 years, may remain a factor of concern. It is a reminder that the world is not on track to meet Paris climate goals.
The China factor
China contributed over a third of the growth in global energy demand, but still significantly slower than its ten-year average. This was driven by a rebound in the output of some of China’s most energy-intensive sectors, particularly iron, crude steel and non-ferrous metals.
This is one of the factors that led to Chinese coal demand increasing after three years of successive falls. The other was cost. Production rose by 3.5%, or 56mn toe, and demand by 0.5%, or 4mn toe. Nevertheless, coal demand in China remains 3.9% below its 2013 peak.
China, with a particularly strong gas demand growth of 15.1%, or 31bn m³, also made a strong contribution to the growth of global gas demand in 2017. It also accounted for almost half of the global expansion in LNG trade, overtaking Korea to be the world’s second largest importer of LNG after Japan.
The country also led growth in solar power, building over 50 GW in 2017 out of the 100 GW increase globally. However, the decision by China in June to cut support for new solar installations will reduce demand this year, and possibly longer, in the world’s biggest market for solar panels.
Going forward, China will be critical to future global energy demand growth and to how energy transition progresses.
Implications for energy transition
BP’s latest statistical review of world energy raises question marks over the global energy transition – it appears to be progressing less rapidly than hoped for.
But BP is advising the reader to take this in stride. The review shows that the structural forces shaping energy transition continued in 2017, with particularly robust growth in renewables and natural gas. Longer-term trends are more important than short-term fluctuations.
As Dudley said: “2017 was a year where structural forces in the energy market continued to push forward the transition to a lower carbon economy, but where cyclical factors have reversed or slowed some of the gains from prior years.”
The power sector is at the leading edge of energy transition, as renewables grow and energy efficiency improves. However, even though growth in wind and solar power was spectacular, providing 45% of the global power demand in 2017, it was not able to keep up with the overall increase in global power demand. A large part of the difference, 42% in 2017, was covered by fossil fuels.
The power sector, being the largest consumer of energy, is also central to decarbonisation efforts during transition. Dudley put his finger on this: “As we have said in our Energy Outlook, our Technology Outlook and now our Statistical Review, the power system must decarbonise. We continue to believe that gains in the power sector are the most efficient way to drive down carbon emissions in coming decades.”
Dale went on to say: “In order to reduce carbon emissions concentrate on power – power – power.” Even small improvements in the power sector can have a strong impact on reducing global carbon emissions. He added “We all want to get to Paris, but it depends heavily on policy-makers and their willingness to increase carbon prices for the benefit of a future which is not well-defined.”
BP reiterated that oil companies are keen on carbon capture and storage (CCS). If CCS does not increase significantly over the next 10 to 20 years, we should be worried. This needs government support. But so far governments appear to be keen in supporting renewables, but not CCS. BP sees this as a failure of public policy.
Non-OECD countries expect big increases in power demand over the next 20 years, while improving the prosperity of their populations. They are aware of the need to reduce carbon emissions, but costs matter and natural gas is significantly more expensive than coal. This makes it a hard balance to strike.
Even though there is a generally accepted view that the world is electrifying, power demand in the developed world has not grown for the past ten years.
In addition, the connection between economic growth and growth in carbon emissions is not quite as ‘decoupled,’ as it was thought to be.
The upshot from this year’s energy statistical review by BP is that the road to meeting the Paris climate goals is likely to be long and challenging.
Charles Ellinas


