A short cold snap leads to storage withdrawal [Gas in Transition]
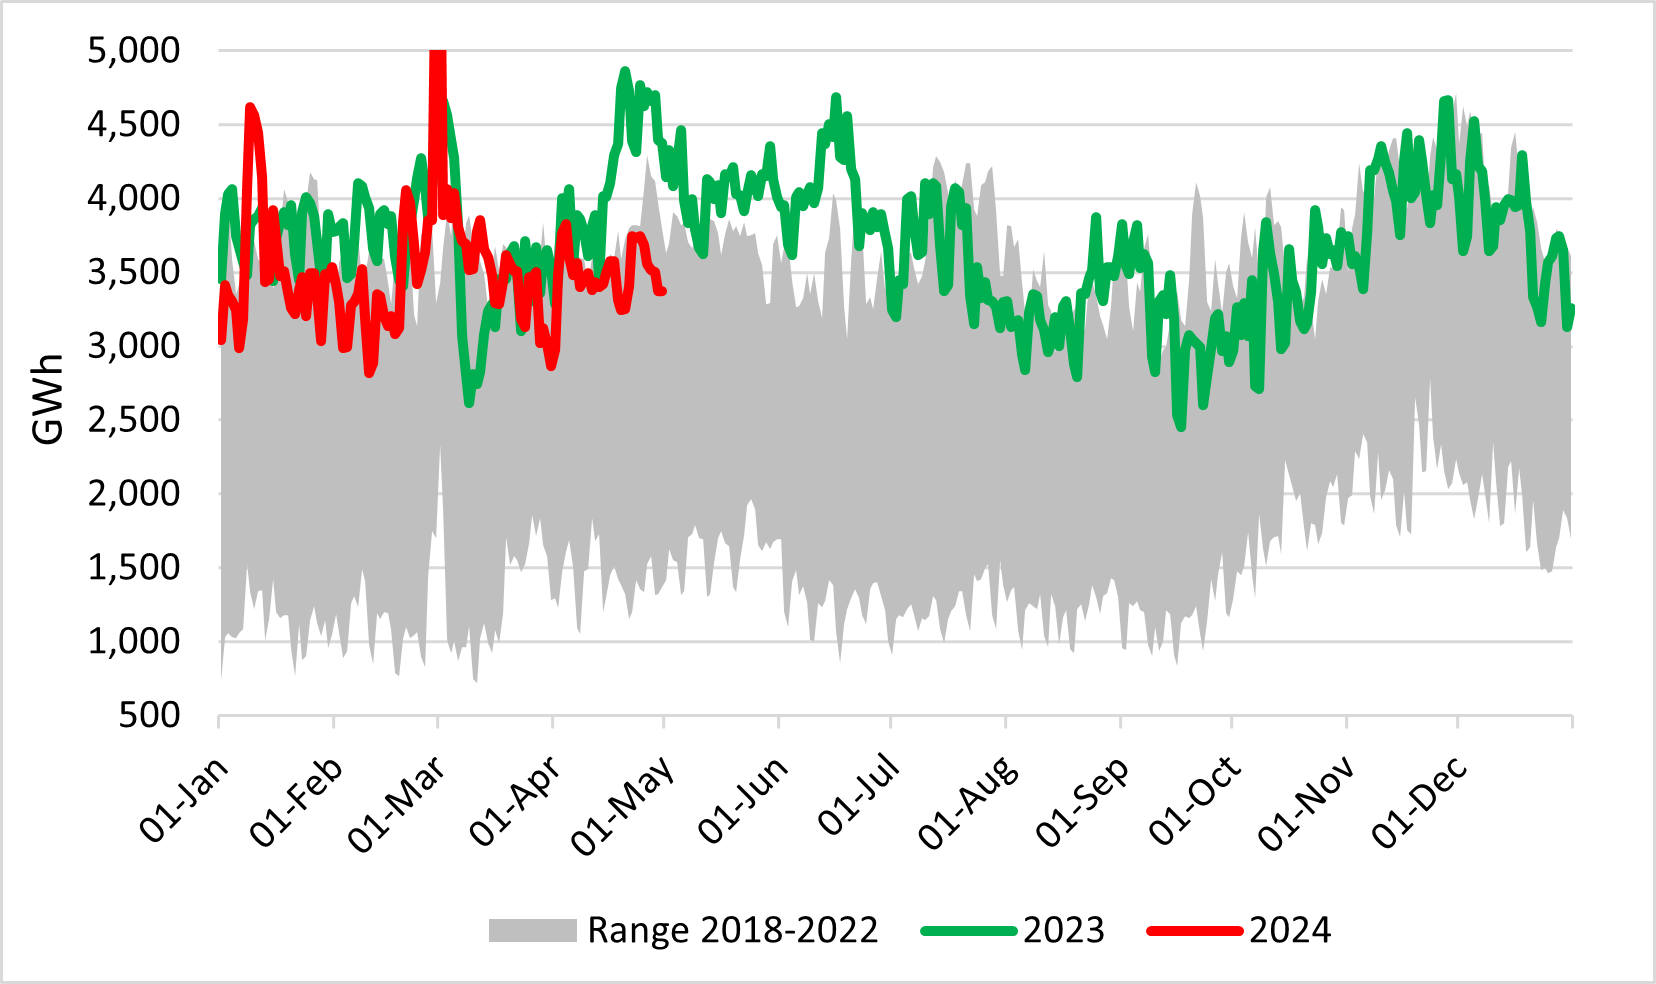
EU electricity generation picked up in Q1 2024, rising 1.1% year/year, having dropped 3% in 2023 to its lowest level since 2015. This is an advance indicator that the EU economy is finally recovering.
EU public net electricity generation in Q1

Sources: Energy-Charts.info, thierrybros.com
With hydro, renewable and nuclear generation all up, respectively by 25%, 12% and 4%, coal and gas power plants had to be switched off. Coal- and gas-fired power electricity were down by respectively a massive 24% (26 TWh) and 10% (10 TWh). For gas demand this equals to a drop of 2bn m3 (or -2.5% versus total 2023 demand on an annual basis.) Power generation could be where we once more the biggest gas demand destruction in the EU this year.
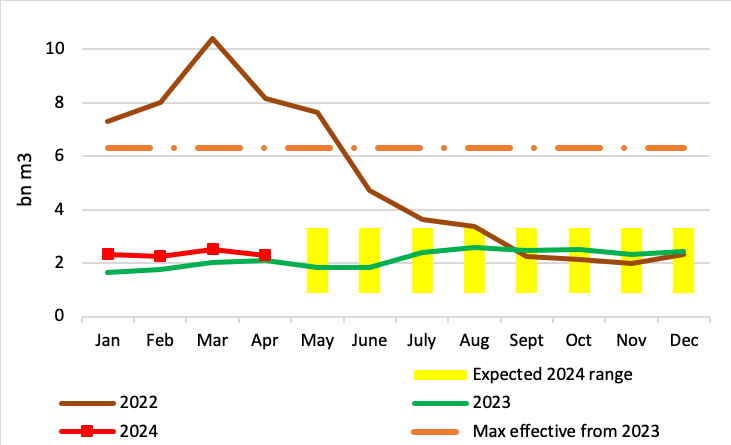
With 2.3bn m3 exported in April 2024 versus 2.1bn m3 in April 2023, for eighth months in a row Gazprom’s exports to Europe are up yr/yr. Since the beginning of the year, exports are up 25%, at a time when EU policymakers discuss reducing demand and ending Russian imports.
Gazprom's monthly gas exports to Europe

Sources: Entsog, thierrybros.com
We should continue to see Russian pipe flows to remain in the expected narrow range between 0.9bn m3/month.
Split of Gazprom's monthly gas exports to Europe by route

Sources: Gazprom, GTSOU, Entsog, thierrybros.com
Since July 2023, LNG send-out is down yr/yr as Asia is back on the LNG market. The European market seems to have gotten used to around $10/mn Btu gas prices. As Asian contracts are oil-linked, as long as Asia takes its contracted volumes, Europe will have to pay a spot price closely linked to the Asian oil-indexation for oil around $85/barrel. After years of trying to move away from oil indexation, Europe is caught back up by the formula it wanted to avoid at all costs.
EU LNG send-out (excluding Malta)

Source: GIE, thierrybros.com
On March 31, with storage facilities filled to a record 58% of capacity, the summer injection period began. Unusually cold temperatures in the second half of April slowed injection rates and led to withdrawals for seven days, allowing the storage level to move back in the historical range; the same level of 62% was achieved back at the end of April 2020.
EU gas storage utilisation

Source: GIE, thierrybros.com
Dr. Thierry Bros
Energy Expert & Professor
May 2, 2024


